Jerome Powell declined to provide clues around the timing for any interest rate cuts when he was interviewed at the Economic Club of Washington DC on Monday. Given this was the day prior to the Fed’s blackout, it all but confirms no cut will arrive in July. Not that one was expected, with market pricing leaning heavily on September and December cuts. However, he added that economic data in Q2 “do somewhat” add confidence that inflation is returning to their 2% target, labour markets are in “better balance” and an unexpected weakening could be a reason to cut rates.
China’s GDP figures fell short of expectations in the second quarter, at 4.7% y/y compared with 5.1% estimate and 5.3% prior. But then again, perhaps expectations are just too high. YTD, growth rose bang on 5%, which hits Beijing's growth target of 'around 5%'. And if there is to be any stimulus announced, the CCP's Third Plenum would be the time to wheel them out. Retail sales fell well short of expectations at 2% y/y compared with 3.3% expected and 3.7% prior.
- Volatility was relatively low on Monday despite news of the attempted assassination of Donald Trump. Although gold did find support around 2400 and rise to within $11 of its all-time high
- The Dow Jones Industrial gapped up above 40k and closed above that milestone level for the second day in a row (and in history)
- The ASX 200 rose for a third to a new record high and finally closed above 8,000
- The Nikkei 225 was closed on Monday due to a public holiday, although Nikkei futures have opened around Friday’s low to suggest an uneventful open for the cash index today
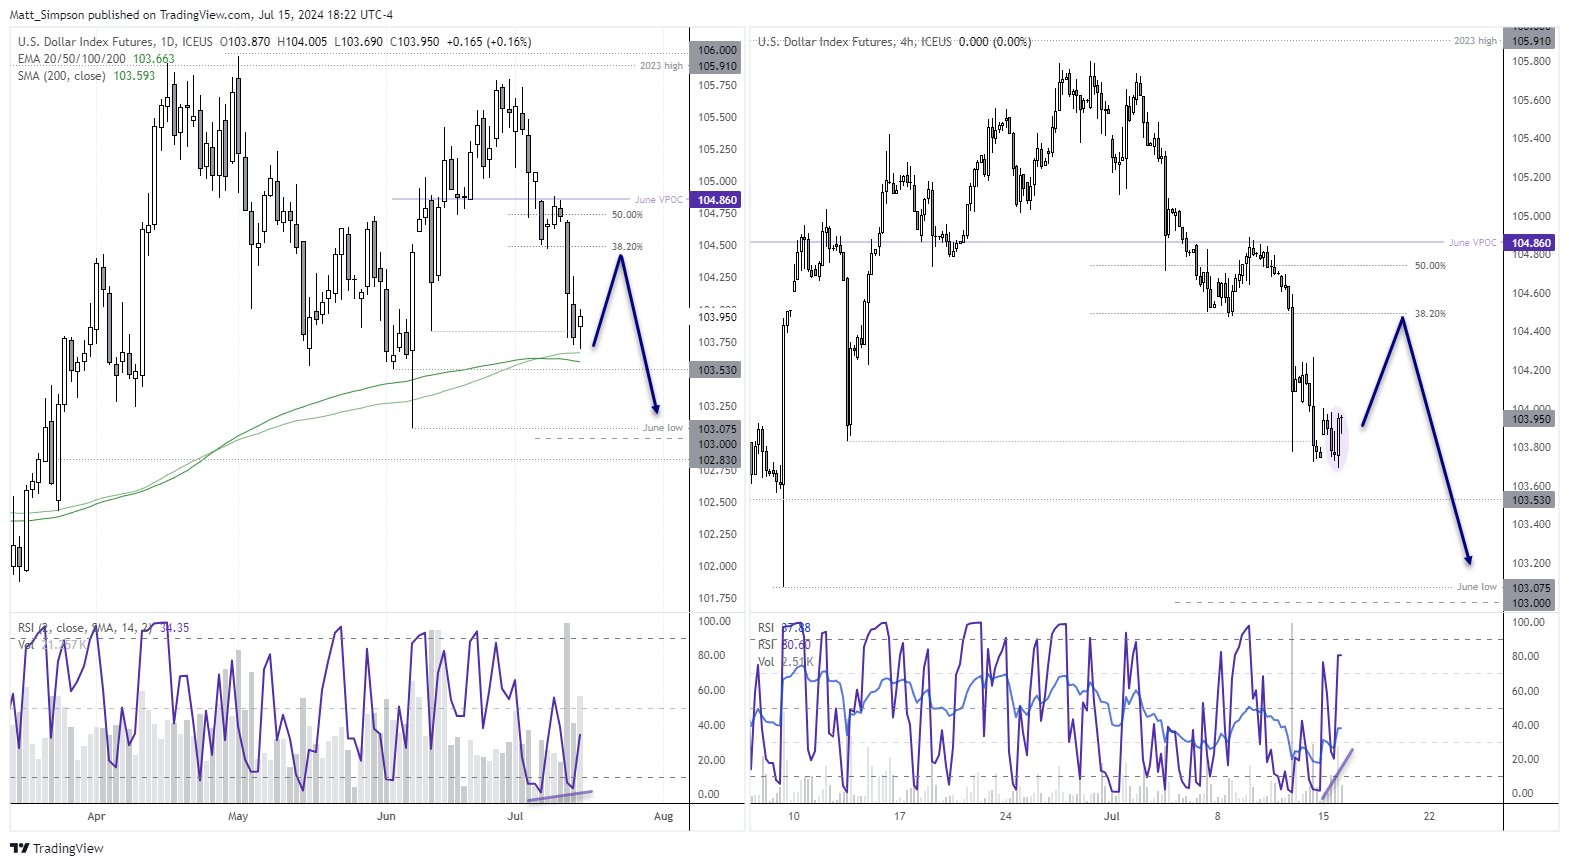
- The USD index found support above its 200-day averages and we’re now looking for a potential bounce (more below)
- AUD/USD erased Friday’s gains to suggest 68c is a temporary ceiling and prices could retrace before its next leg higher
Events in focus (AEDT):
- China Communist Party’s Third Plenum
- 08:45 – New Zealand
- 14:30 – Japan’s Tertiary Industry Activity Index
- 19:00 – German ZEW economic sentiment, EU trade balance
- 22:30 – US retail sales
- 22:30 – Canada CPI
- 00:00 – US business inventories, NAHB housing
- 02:00 – US Atlanta Fed GDNnow
- 04:45 – FOMC member Kugler speaks
USD index technical analysis:
As mentioned in previous articles, I expect the US dollar to face further selling pressure in the coming weeks. But that does not mean it cannot provide a few bounces along the way. And I suspect one is near.
The daily chart shows that prices are holding above the 200-day average and 200-day EMA (exponential moving average). A small bullish candle formed on Monday to snap a three-day bearish streak which, when coupled with a relatively large volume candle, suggests a 'change in hands' from bears to bulls. A bullish divergence has also formed on the daily RSI (2).
The four-hour chart shows a bullish engulfing candle as momentum is trying to turn higher, after a break of a previous swing low. Bullish divergences have also formed on the RSI (2) and (14) from their oversold zones.
Bulls could seek dips towards the 200-day EMA or within Monday's range with a stop below 103.53 and seek a countertrend move towards 104.40, just below a 38.2% Fibonacci level.

USD/JPY technical analysis:
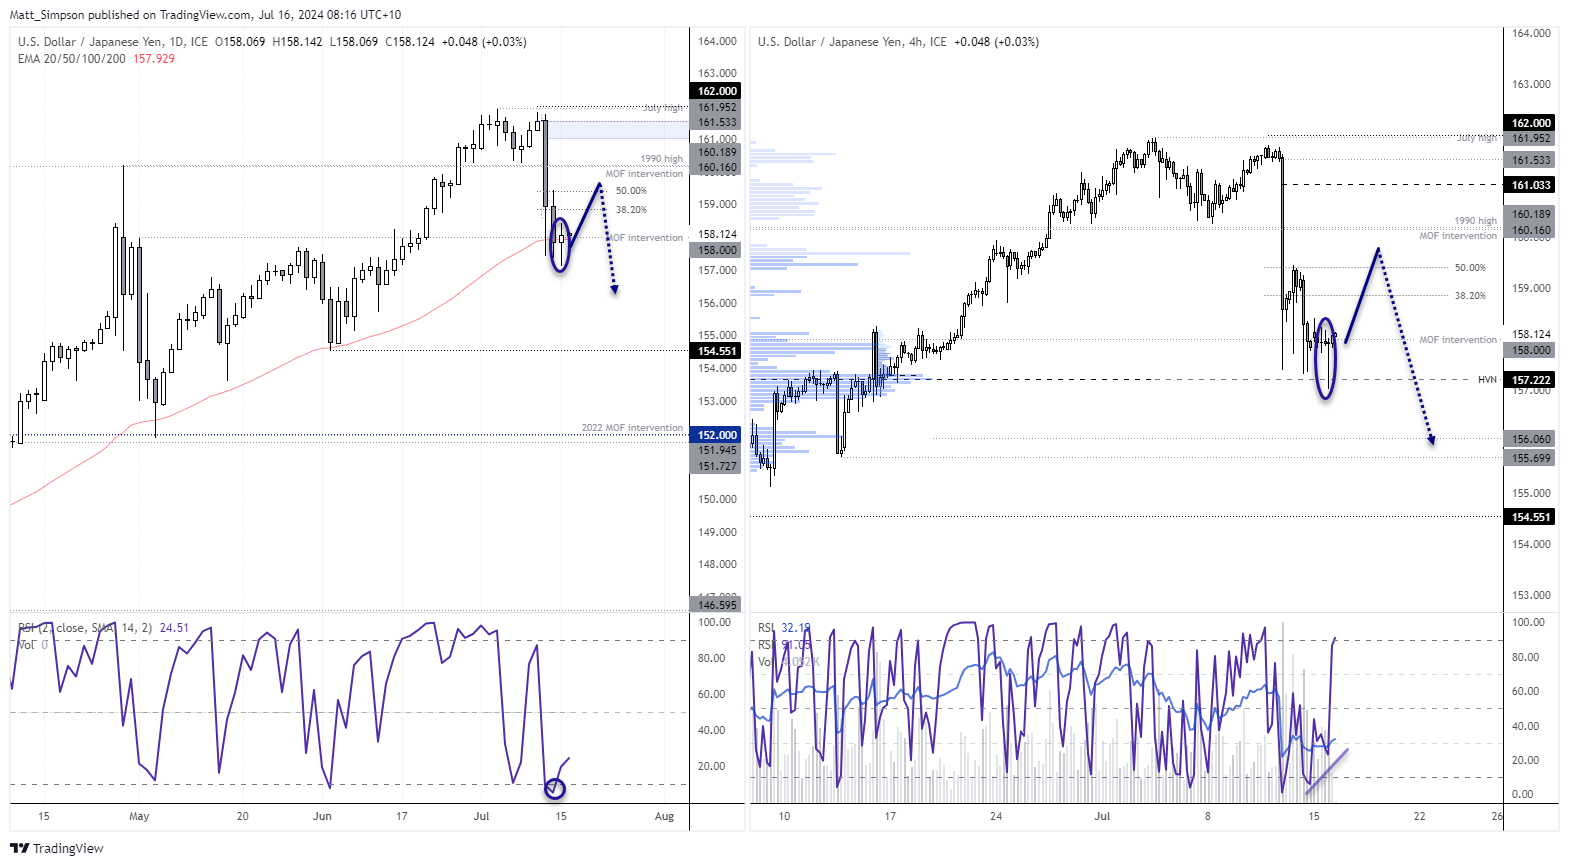
The softer US CPI report on Thursday saw USD/JPY fall -2.9% to Friday’s low, where many suspect there was another MOF intervention upon the data release. Yet volatility receded on Friday and Monday, to the point of a small bullish doji that is now clinging to the 50-day EMA. The daily RSI (2) also reached oversold on Friday.
The 4-hour chart shows a bullish divergence on RSI (2) and (14), both of which had reached their oversold zones. A bullish pinbar also formed on this timeframe after it found support around the high-volume node (HVN) of the prior rally at 157.22.
Like the USD index, I suspect a countertrend bounce is due. And it could begin around the Tokyo open. A strong US retail sales report later today could help it extend gains.

ASX 200 futures (ASX 200) technical analysis
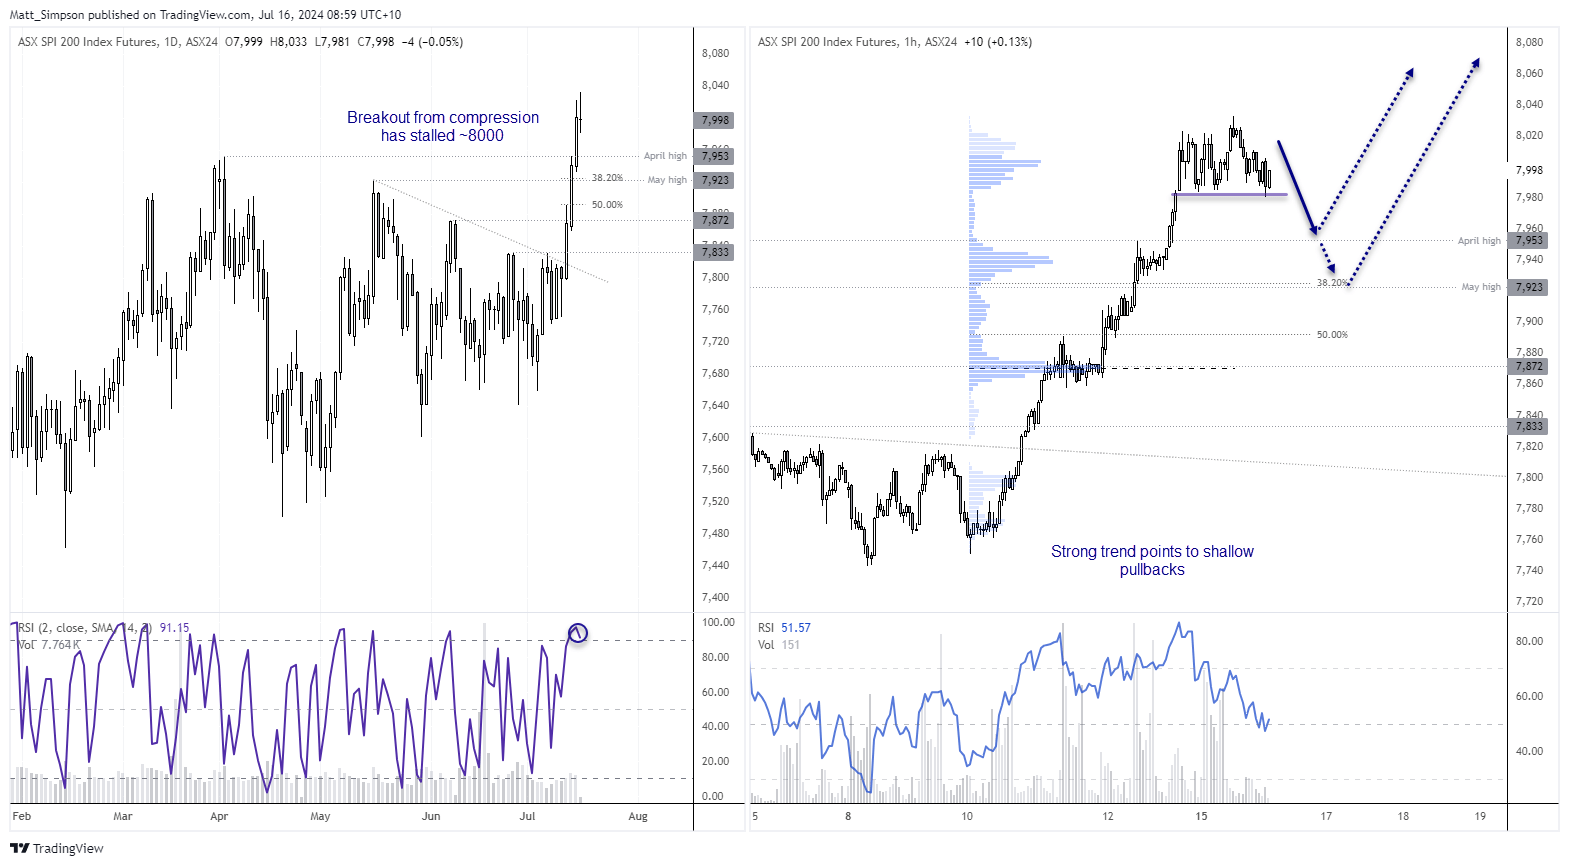
Australia’s prime stock market provided a clean bullish breakout from its compression pattern to send the cash index above 8,000. We’re looking at the ASX 200 futures market below (SPI 200) as the market trades through the European and US sessions and includes official volume figures.
The market has stalled around 8,000 ands the daily RSI (2) has reached overbought, to suggest at the very least that the meat of the breakout is done. But with prices already hesitating, perhaps it is ready to enter a period of consolidation or post a minor pullback. I say minor, because the move higher on the 1-hour chart is overwhelmingly bullish. Ans that tends to point to shallow retracements.
Prices are consolidating on the 1-hour chart, and volumes have been very low this week so far to show a lack of initiative trading. Pullbacks towards the April or May high could appeal to bulls seeking its next leg higher.

View the full economic calendar
-- Written by Matt Simpson
Follow Matt on Twitter @cLeverEdge


