Mastering stocks and indices
What moves the prices of the world’s biggest indices?
Learn what drives the prices of the S&P 500, Dow Jones Industrial Average, FTSE and DAX here.
As we covered in the Introduction to trading indices, an index's price movements are determined by the stocks it tracks. Industry news, earnings reports and political announcements will all play out across an index.
However, since each benchmark index represents a different group of stocks, they each have unique factors to watch out for. Let's explore some key examples.
S&P 500
The S&P 500 is a gigantic index, tracking the 500 biggest public companies in the world's biggest economy. The total market cap of the stocks it follows is over $30 trillion – over ten times more than for the FTSE 100.
With such wide coverage, no single sector totally dominates the US 500, although tech has risen to a strong position. Whereas tech stocks make up around half of the NASDAQ 100, however, they're just 20-30% of the S&P.
Instead, most traders see the S&P as a broad metric of the US economy. If the United States is in a period of growth, the S&P usually grows too. In times of recession, it will shrink.
Some stocks will have an outsize impact on the overall index, though. Thanks to its capitalization-weighted model, the ten biggest US companies make up around a quarter of its total value. The FAAMG stocks – Facebook (now Meta), Apple, Amazon, Microsoft and Google (listed as Alphabet) – alone are responsible for some 20% of the S&P's movement.
So, despite not being a tech-focused index, anything that will benefit or harm the world's biggest technology companies will likely do the same to the S&P 500.
Dow Jones
The Dow Jones and S&P 500 both claim to track the performance of the US stock market. But they do so in totally different ways.
The Dow follows just 30 companies, which are picked by hand instead of representing the biggest stocks by market cap. Because of this, you'll probably find a number of major US stocks missing from the Dow.
Plus, the DJIA places more weight on companies with high share prices. In practice, this means that the likes of UnitedHealth Group, Home Depot, and Goldman Sachs – who all have high share prices – can together make up more than 20% of the index's weighting.
Apple, meanwhile, is less than 3%.
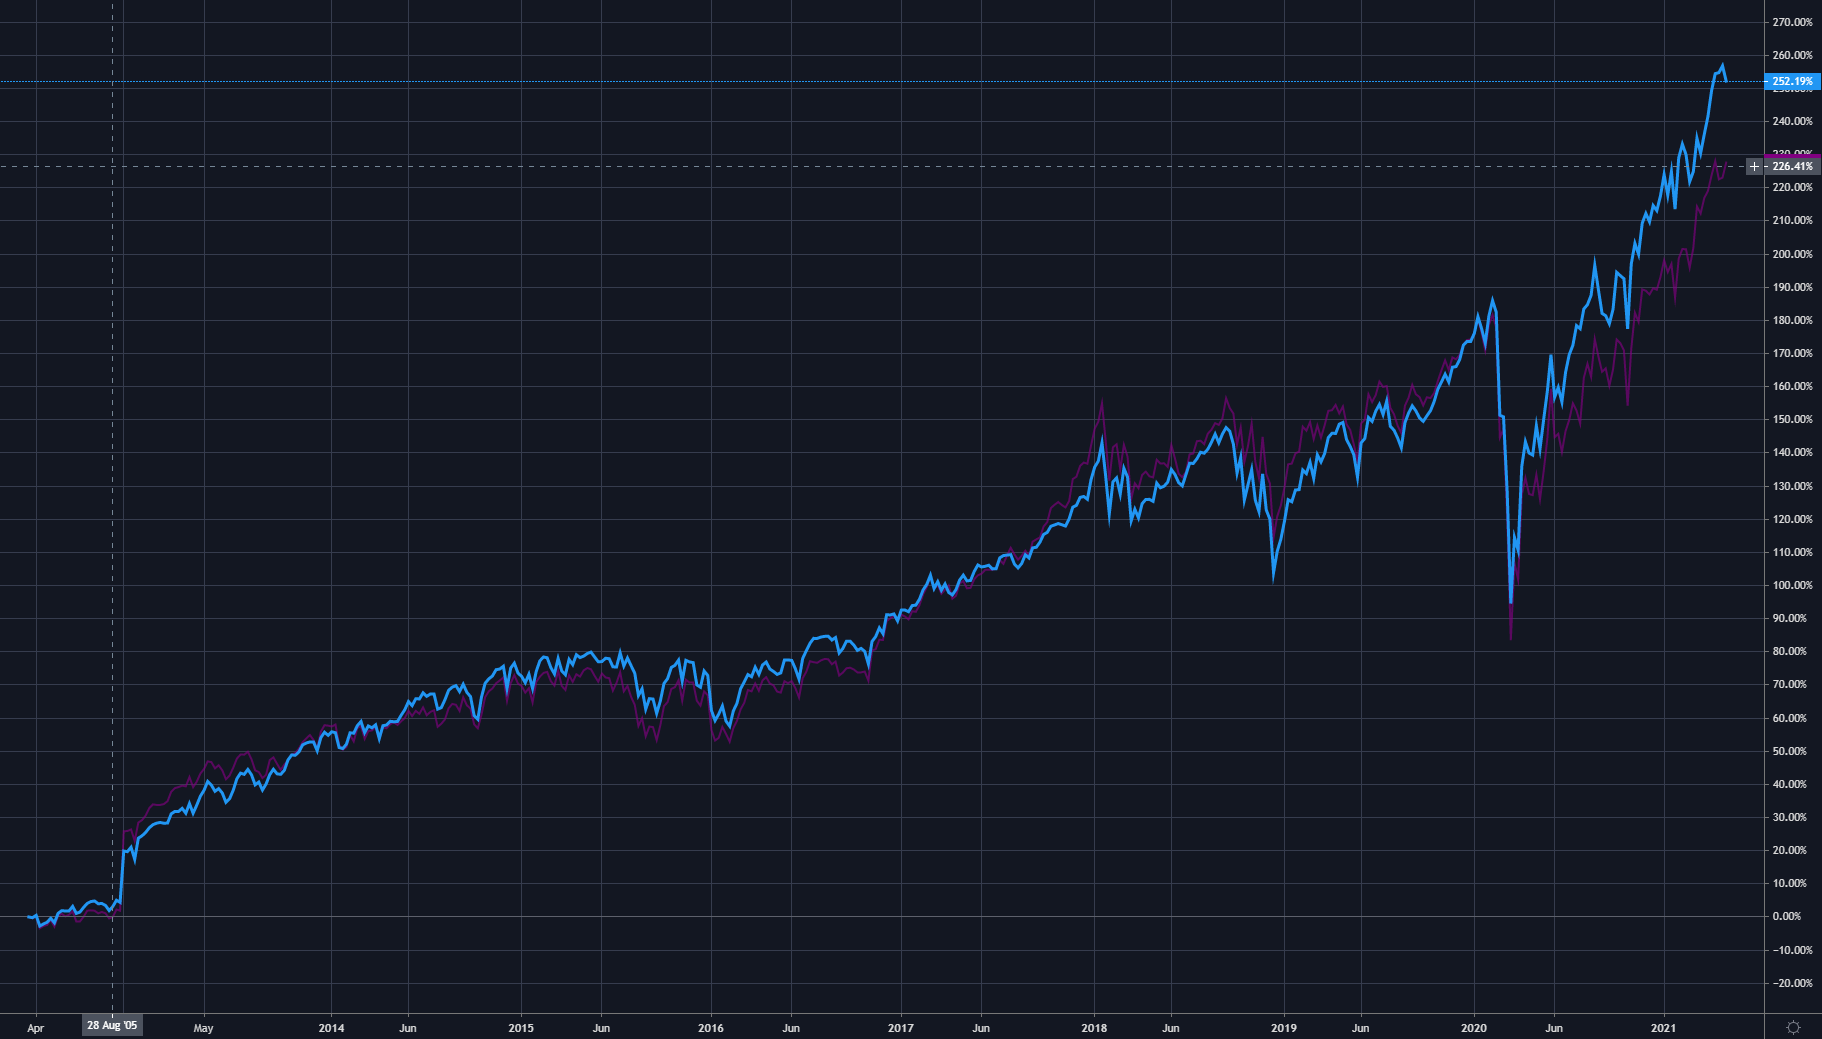
However, the Dow Jones and S&P are still incredibly closely correlated. Take a look at the chart below – historically, there hasn't been much to separate the two indices.

Because of this correlation, the factors that move the S&P will tend to have the same effect on the Dow. Good news for the US economy will see it rise; bad news will see it shrink. That being said, it should also be noted that there is no guarantee that the two will be or likely to be correlated in the future.
FTSE 100
The FTSE 100 has traditionally been dominated by three sectors:
- Financial services (HSBC, Lloyds and Barclays)
- Oil & gas (BP and Royal Dutch Shell)
- Consumer goods (Unilever, Diageo and British American Tobacco)
Each of these might comprise around 20% of the index's total weighting at any time, so can have a significant impact on its overall price.
Perhaps the most significant factor to watch when you're trading the FTSE 100, though, is the price of the pound.
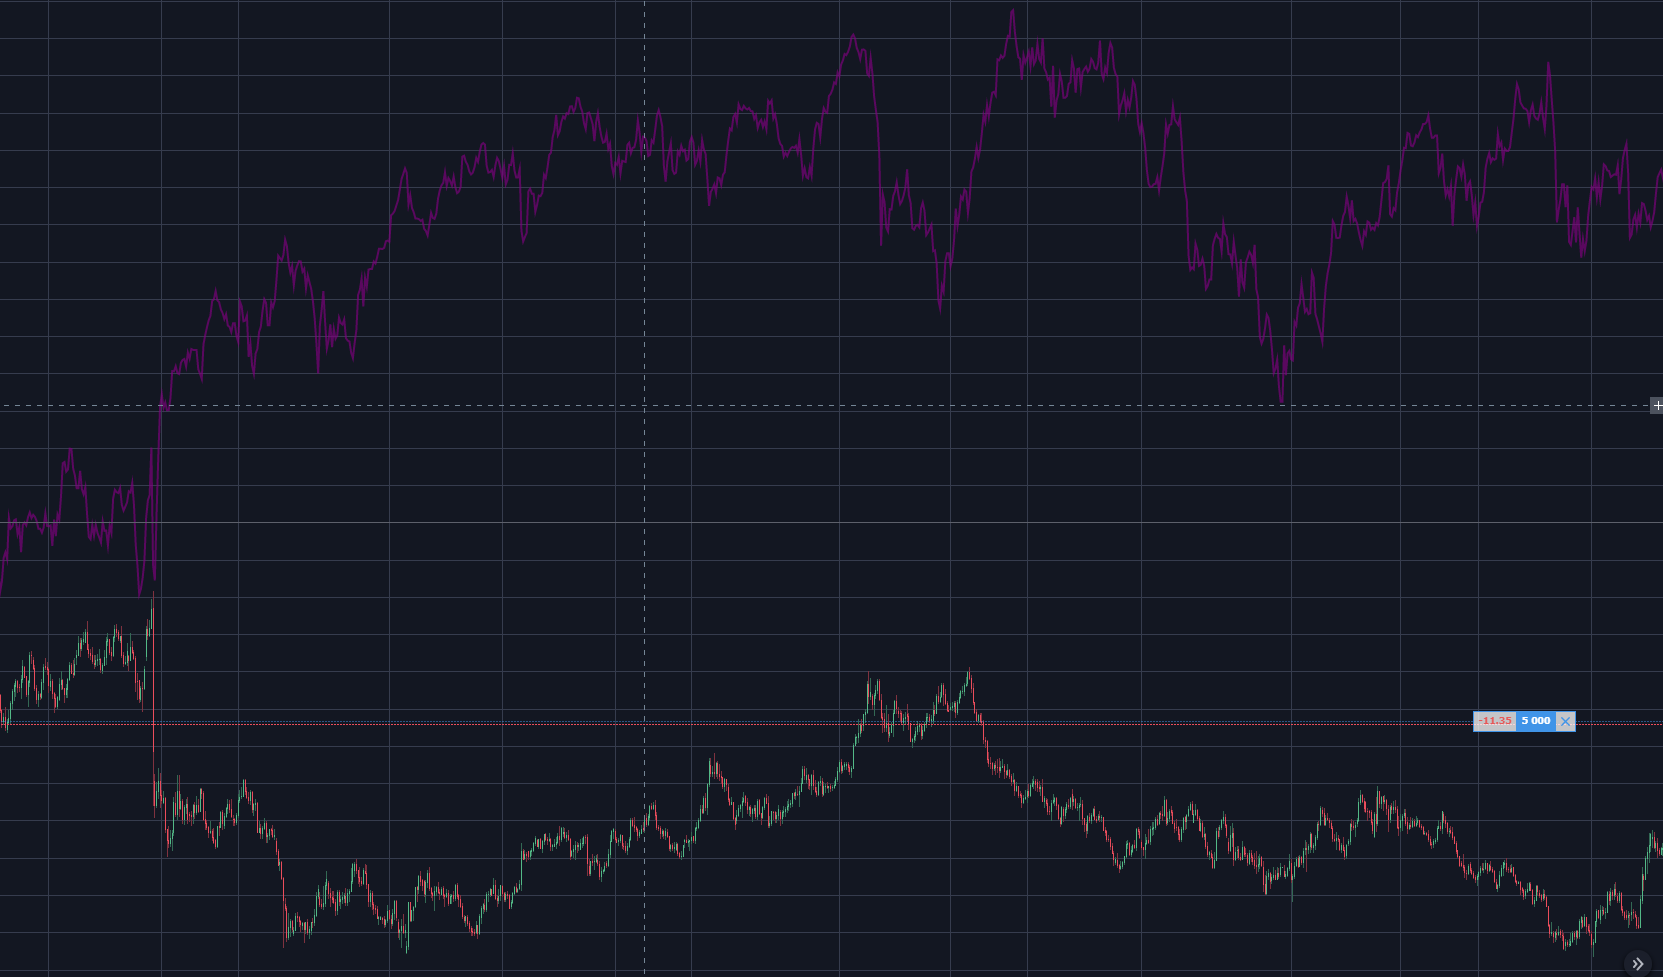
GBP and the FTSE 100 have historically shown a strong negative correlation. When the pound is strong, the FTSE can struggle; when the pound is weak, the FTSE might rally.
Why? Because the companies on the FTSE 100 are mostly very international-facing. Some 70% of their profits come from outside the UK. When the pound is weak, these exporting companies make more money in pound terms – and the FTSE grows.

After the Brexit vote in 2016, for example, the pound tumbled. That provided a tailwind for FTSE 100 firms, and the index rallied to new record highs, despite the new political uncertainty.
The FTSE 250, on the other hand, is much more domestically focused. If you're looking to take a position on the strength of the UK economy, the 250 might be a better bet.
DAX
Despite only representing 30 companies, the DAX is rarely dominated by a single stock or sector. The top industries on the index, though, are materials (Linde, BASF) and financial services (Allianz, Munich Re, Deutsche Börse).
A core set of companies have remained on the DAX for several years. As the index celebrated its 30th birthday in 2018, 15 companies had been continually on it since its inception.
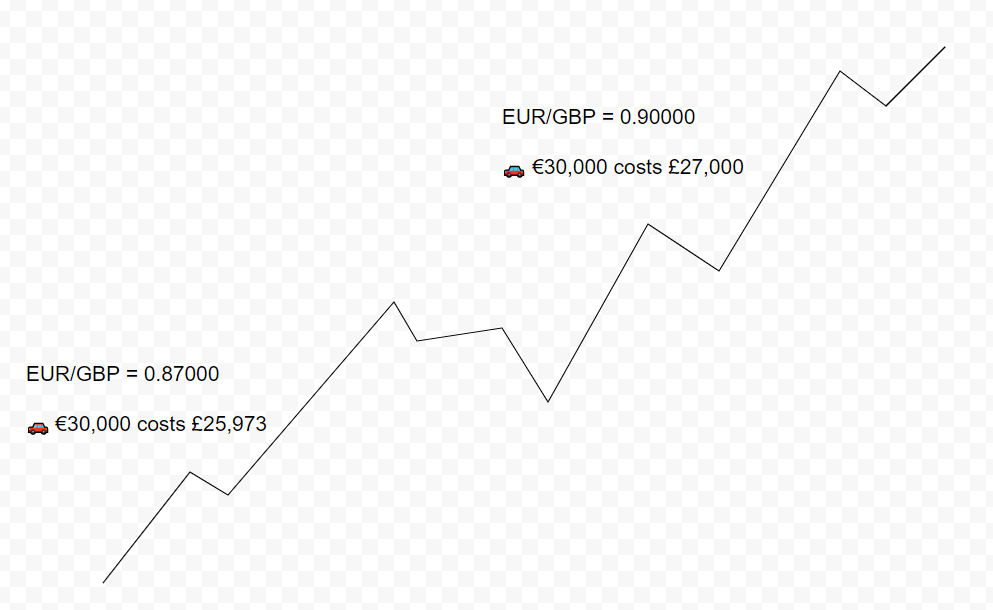
The DAX's constituents might be stable, but the index itself tends towards volatility. And, like the FTSE, it is mostly home to external-facing businesses. So, the strength of the euro can have a major impact on its price.

If the euro is particularly strong against the pound, for instance, a €30,000 car from a company like Volkswagen will be more expensive to purchase for UK consumers, but still only make €30,000 for Volkswagen. This could lower demand, or force VW to reduce the price of its cars – hurting its bottom line.

